▲ 219 points
back
190 comments
There's another thing that happens with busses that makes it worse.
The further behind the previous bus a bus is, the more people will arrive at the bus stop. The more people there are at the stop, the longer the bus has to spend picking them all up and selling them tickets etc. Therefore the delayed bus will tend to experience more delay. The bus behind them will have less people to pick up, so it will spend a shorter time at stops and tend to catch up with the first bus, so the two busses are dragged towards each other.
This phenomenon consistently happened to my college bus system, but on an even worse scale. The main bus line did a loop around campus, which took ~20 min to complete and buses scheduled every 5 minutes. In reality, you got a caravan of 4 busses arriving every 20 minutes, with the first one totally full and the last practically empty.
That bus with more riders on board also has a higher probability of needing to stop to let people off at each location as well, slowing it down even further!
If you track the busses, this should be as easy as changing one bus to "bus full" and have the emptier bus behind it picking up the passengers for a while. That will speed up the fuller bus and slow down the bus behind it.
>the longer the bus has to spend picking them all up and selling them tickets etc.
In my country, apart from an app/ online, you can buy a ticket pretty much anywhere. I guess someone worked out that bus drivers with money are a potential theft risk, and also that selling tickets on the bus takes time and makes busses late(r than they would be).
Also buses are more likely to let other buses out in traffic so that's another reason why you get clumps of buses arriving rather than regularly spaced ones
That's why city buses have 3 or 4 double doors and there's ticket machines inside (and drivers don't sell tickets). The time to board rarely goes over 15 seconds.
Compare:
https://www.lubus.info/images/stories/taborbus/5122-57.jpg vs https://www.chicagobus.org/system/photos/250/large/DSC00925....
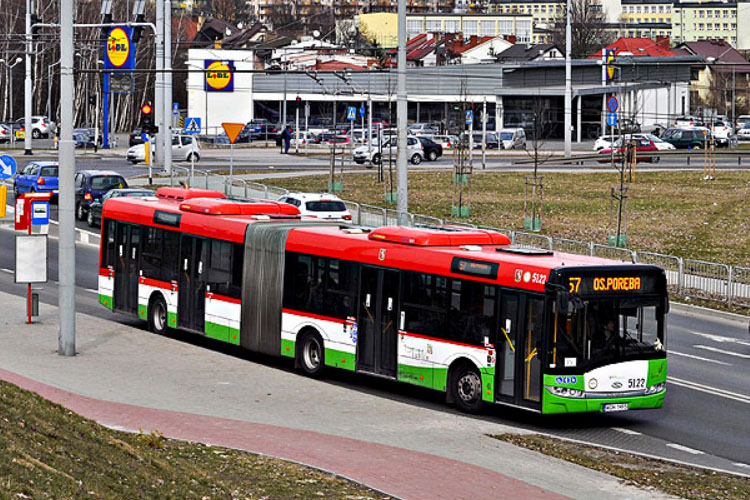

That's double the boarding time at every stop right there.
The schedule is also designed in such a way that the bus is usually ~1 minute ahead of time and can wait for the proper time to depart from each bus stop - zeroing the randomness on each stop. If it gets too delayed on one part of the route it can catch up on next few bus stops.
On intercity routes there's fewer bus stops so usually there's just 1 door and the driver sells the tickets.
This is why good back office daspatch is needed. If the bus is late slow the following but and/or add another.
Some bus systems handle this (partially) by only allowing passengers to disembark from the lead bus. Stop, open the back door, don't open the front door, take off. I don't know either way, but the belief is that it helps smooth it out over time.
This seems easily fixable for buses, since they can overtake each other. Once the empty bus is in front, it is the one arriving first to pick passengers, while the full bus empties.
In practice I see buses slowing down or stopping to keep their ordering, and I don't understand why.
(Of course that doesn't work for trains which can't overtake)
That's why "dispatcher" is an actual job.
There are still buses that sell tickets :O May I ask where? This has been shut down years ago where I live for the time it takes as you say.
this is called bus bunching and is a well studied phenomenon.
Isn't that when the second bus just sits idling at one stop for 5-10 mins? That's what they do here in SF ¯\_(ツ)_/¯
It's not just that the bus is always late, it's also that when you are late yourself, the bus is always on time and just leaving.
When I first started going into the office regularly back in February, I would stop in a 7-Eleven a block away from my “L” stop on my way in.¹ Every day for the first couple of weeks, I would watch the train leaving the stop right when I walked out of 7-Eleven, regardless of when I left my apartment.
My solution has been to stop looking at the station when I leave 7-Eleven.
⸻
1. I still do.
Yes, or my favourite: the bus shows late and then later and later and later on the “next bus” feature on my phone, then eventually it jumps 20 minutes indicating the bus has been cancelled for that cycle, so I start walking home, only for the bus to show up when I’m just too far from the stop to reach it!
I feel this is my bones
Yes. This is the key piece to understand this "paradox":
> you arrive at a random time
So, um, if you intend to take public transit, it's best to not arrive at a random time. Looking at the time tables and planning around them is public transit user 101.
or worse. leaves two minutes early when you're right on time.
My favourite corollary of this is that even if you win the lottery jackpot, then you win less than the average lottery winner.
Average Jackpot prize is JackpotPool/Average winners.
Average Jackpot prize given you win is JackpotPool/(1+Average winners).
The number of expected other winners on the date you win is the same as the average number of winners. Your winning ticket doesn't affect the average number of winners.
This is similar to the classroom paradox where there are more winners when the prize is poorly split, so the average observed jackpot prize is less than the average jackpot prize averaged over events.
That's true if you are cheating, for example by knowing the numbers in advance, guaranteeing a win. The cheater is the "+1" in your argument, an extra player with a 100% win rate.
But if you are not, and pick a random time where you win, on average, you will win as much as the average lottery winner.
For the classroom paradox to work, you have to take the average prize per draw after splitting, not the average prize per winner.
For example, if there are 9 winners in the first draw and 1 in the second, then there are 5 winners on average, so the average prize is 1/5. If you are one of the winners, there is 9/10 chance you are among the 9 and only win 1/9, which is less than average, but there is also 1/10 change of winning full prize, which is much better than average. If you take a weighed average of these (9/10*1/9+1/10*1) you get 1/5, back to the average prize. The average individual prize per draw is (1/9+1)/2=5/9, but it is kind of a meaningless number.
Another way to see it is that most of the times, you will win less than average, but the few times you win more, then you will win big. But isn't it what lotteries are all about?
Another one is that your friends on average have more friends than you. (Because you are more likely to be friends with people who have many friends than with people who have few friends.)
> Average Jackpot prize is JackpotPool/Average winners.
> Average Jackpot prize given you win is JackpotPool/(1+Average winners).
That doesn't make a lot of sense.
Maybe you mean that most winners get less than the average prize.
Let's say that there is $1m jackpot and there could be one, two, three or four winners (with equal probability).
To simplify the calculation, let's say that each outcome happens once.
The average prize is $400k (4 x $1m / (1+2+3+4)).
A winner has 40% probability of getting just $250k and 30% probability of getting $333k.
----
Edit: Or maybe you tried to say something like the following but didn't get it right because "average winners" means different things when you win and when you don't.
> Average Jackpot prize is JackpotPool/Average winners when there are one or more winners
> Average Jackpot prize given you win is JackpotPool/(1+Average winners when there are zero or more winners).
This is (technically) wrong, but not for the reasons I've seen others give so far. Your reasoning is basically fine, but your definition of an average jackpot prize is not. If we have k lottery winners and we denote each individual prize as n_i, then the average prize is sum(n_1 ... n_k) / k. It's pretty easy to see that number cannot possibly be larger than all individual n_i and thus it cannot be the case that "you" won less than the average prize for all possible yous. Some winners win less than average and some win more, or they all win exactly the same amount.
On the other hand, your analytically computed expected winning is indeed less than an analytically computed expected average prize, when conditioned on the fact that you won, because you are more likely than not to be in a lottery that has more winners than the average lottery. This is mathematically the same phenomenon as the thing where the perceived average class size if you sample random students is greater than the actual average class size, because more students will be in the larger classes. This doesn't mean every class is larger than the average class, which is not possible. It just means that if you randomly select a student, you have a better than 50/50 chance of selecting someone in a larger than average class.
> Your winning ticket doesn't affect the average number of winners.
I think this is a good hint that the conclusion isn't true. Just think about what it would mean if this were true for a sample of lotto winners. For a winner, if they win, their average number of winners is higher than the global average. Repeat this logic for each individual winner... And every winner wins with a higher number of winners than the average. Which is clearly impossible.
It would be true if you were guaranteed to win, since that's the assumption you have conditioned the probability on, but that's not a lottery then. If you want to get the actual expected value across all samples you need to take a weighted sum including the expected value when you don't win.
But, somehow, lighting a cigarette at the station makes the bus spawn instantly. 100% reproducible.
Related reading; explains the same concept quite well IMO with NYC subway data. This is where I learned about this concept.
>when the average span between arrivals is N
minutes, the average span experienced by riders is 2N
minutes.
Who is arriving in the first part of the sentence? At first I thought he meant the bus arrival, thus N = 10, and 2N would be 20. But then he says
>The average wait time is also close to 10 minutes, just as the waiting time paradox predicted.
10 isn't 20 so ???
my take away is that if you're lucky enough to live in a place that has such a bus schedule, you can just ignore the schedule and show up whenever you want and only wait 10 minutes. sounds lovely!
Renewal theory! https://en.wikipedia.org/wiki/Renewal_theory
I haven't read the article but just to answer the question in the title: Buses must always be late because a bus that leaves early is even more useless.
Related: Suppose Bitcoin's difficulty is tuned correctly to the target block time of 10 mins/block. Then, if you pick a block uniformly from the list of blocks, its expected length is 10 minutes. However, if you pick a point in time uniformly, the expected length of the block it's in is 20 minutes.
This seems more to say that the average time of all passengers waiting will be close to the interval, but that the average time for any individual in a given stop will be closer to half? (Similarly, if you are discussing the longest time you will wait throughout the day and you have multiple stops you have to wait at, it will drift up to the the interval time.)
That is, they sound like similar questions, but they are not. How long can one random person expect to wait at a stop is different from how long a population will wait at a given spot. In large because a person can only arrive at a single time in the waiting interval, but more passengers become less likely the closer to departure time.
(I realize I didn't word all of this as a question, but I am not asserting I'm correct here. Genuinely curious if I understand correctly.)
This is one of my favourite queueing theory-adjacent consequences.
As the article notes, it's the same reason the average coin in a sequence of tosses will be in a longer run than the average run length.
Does this relate in any way to the phenomenon of "lighting a smoke to make the bus come?" you see, you're waiting for the bus and after a few minutes you realize "man, I could have had a smoke by now" so you light a smoke, but sure enough the bus will come before you can finish your cigarette. This seems to happen every time you light the cigarette waiting for the bus. So this time you get to the stop and light your cigarette right away so that the bus comes, to no avail. What gives?
There is a mildly related math puzzle I learned at some point in high school (iirc):
someone comes to a subway station at (uniform) random times between 6p and 8p; he notices that the first train he observes arriving at the same station is 3 times more often inbound than outbound. He also knows that time intervals between the trains going in the opposite directions are fixed and equal — say, always 6 minutes, so the only random event here is when this person arrives at the platform. Explain how this is possible.
(2018), but this article is timeless…
Past discussion: https://news.ycombinator.com/item?id=18321062
Ah, but it's on time those times you are late but really need to get that one departure for some important meeting or similar.
edit: interesting post with a different ending than I imagined.
Been thinking about using some statistical methods to give me some better estimates of the busses I take to work. Like "given that it's $today, which is a Tuesday, it's 17:30, and the display says the bus is 7 minutes delayed, how long til it will actually come?
(2018)
Some discussion then: https://news.ycombinator.com/item?id=18321062
I would say just use the app that says at which bus stop the next bus is and when it estimates its arrival.
OK sometimes the app / bus location system fucks up but most of the time or their are unexpected road road work or traffic accident that suddently forces it to be slower but most of the time it is pretty much accurate.
In combinatorics we calculated that the typical wait time is very close to the actual planned interval.
Same thing is true for Bitcoin block times (also a Poisson process), a block is expected to arrive every 10 minutes on average but if 10 minutes (or 15 or 20) have passed since the last block the expected time for the next block is still 10 minutes.
This was easily the most memorable thing I learned during my statistics degree! Nothing else has stuck with me this well.
I got asked a variation on this in an interview several decades ago.
"What is the expected waiting time for a bus that arrives on average every ten minutes and you show up at a random time". I was sure it was 5 but they actually wanted me to do the math from the article, in my head, in 30 minutes. I did not pass that interview and did not get the job (which was a good thing long term).
I really enjoy having 10-20 lines that produces the expectation value directly by simulation; that's a fast way for me to understand the underlying values.
Why does he times tau by N when calculating the bus arrival times in the beginning?